Monitoring the Web with Azure for Free
With the deprecation of Multi-step Web Testing in Visual Studio and Azure, what approach can we now use to monitoring web properties, especially if we don’t own them? In this post, I’ll propose and demonstrate the leveraging of Azure to provide us a solution to this problem at no-to-little cost.
Multi-step Web Test Deprecation
Announced here, this deprecation means that Visual Studio 2019 Enterprise will be the last version of Visual Studio to support Multi-step Web Test projects, and no replacement is currently being worked on. This enterprise-only feature was not overly enviable anyways considering these tests are HTTP-based only (no Javascript) and the pricing was pretty out there, for example West US 2 / AUD pricing is shown below.
| Feature | Free units included | Price |
|---|---|---|
| Multi-step web tests | None | $13.73 per test per month |
| Ping web tests | Unlimited | Free |
A Better Solution
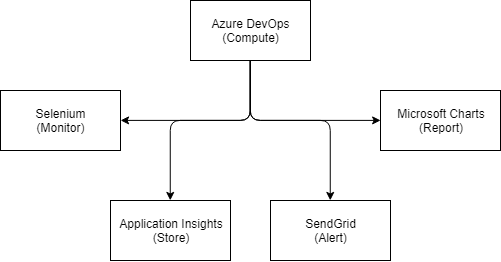
I’m looking for a more modern solution with a feature set greater than what’s possible with Multi-step Web Tests. We’ll use Azure to host it, and if we go with the bare minimum then this solution can be entirely free. For a few cents a month we can add additional features that compliment the idea of monitoring web properties that might not be our own.

This solution is entirely opensource and available for free on GitHub. If you have ideas on how this solution could be improved, please let me know!
Browser Automation
To solve the core requirement of monitoring availability, request times and whether our single page applications are executing javascript correctly, we’ll use Selenium. We’ll control it with .net core, using plain old mstest which we (or more likely our automation) can run easily with dotnet test.
There’s plenty of guidance on writing tests with Selenium, and it’s good practice to use a Page Object Model approach when using Selenium. An example I’ve written loads up azure.com, navigates to the pricing page, and tests some assertions on what it finds using Shouldly.
I’m using ChromeDriver with Selenium, which we can pass further arguments to for example, to avoid tracking integrations like google analytics and to run headless so we can run it on linux vms without a graphical environment.
Running It In The Cloud
I need something to periodically run the above test project, and Azure DevOps is the free answer, with 1,800 free hosted build minutes per month. I can implement a build pipeline that will run the tests and email me the results. There’s even a dashboard widget to show how my tests have performed over the last 20 runs, including how long the run took and whether any tests failed.
The build pipeline configuration is pretty trivial. Whenever a build is triggered, a hosted linux agent will run the following steps;
- Install dotnet core 2.2
- Restore nuget packages
- Build the project
- Run the tests
- Publish the result
Scheduling the build is also quite trivial, especially now that Azure Pipelines supports scheduling with cron syntax. Triggering every hour is as simple as the snippet below. Remember to set always: true so the build is triggered regardless of no change being committed to source.
schedules:
- cron: '0 * * * *'
  displayName: Hourly build
  branches:
    include:
    - master
  always: true
Cron schedules are fairly new to Azure Pipelines and were broken on my initial implementation. While the fix was coming through I instead used Logic Apps to schedule the build. Logic Apps already includes an Azure DevOps connector and a two step app was all that was required - a periodic recurrence and a build trigger. Now that Cron schedules are fixed however, the Logic Apps approach is no longer required.
Additionally, Cron schedules are only reliable if your Azure Devops tenant is in constant use. The docs explain that the tenant goes dormant after everyone has logged out - if this occurs to you, a Logic Apps approach will ensure your builds get triggered.
Storing the data
A great way for us to both store and query the data we’ll be collecting is to use Application Insights. Normally we’d use the Application Insights SDK to automagicially track our own website’s data - however as we’re monitoring other websites out on the internet, we’ll just include the Base API and use TelemetryClient directly.
I’ve written ApplicationInsights.cs as a wrapper around TelemetryClient, and it shows we’re sending Availability and Exception telemtry to Application Insights. Integrating this with our Selenium tests and configuring the Instrumentation Key results in our data being available for querying in the Azure Portal.
We can review up to 90 days of data in the portal, using Kusto to query and create charts. We can also query the data externally by using the Application Insights REST API and we’ll do so below to generate reports that will snapshot our prior to reaching the data rentention limit.
Notifications and Alarms
There’s two key events we want to be notified of:
- Test failures and;
- When the whole system is down and not monitoring.
Test failures are already being emailed by Azure DevOps, but the content of the email could be a lot better than this. We can extend the existing test project to build a summary of failures once all tests are complete. Even better, we can use Selenium to grab screenshots of the browser at the point of failure and include these images in the email.
We can detect that the whole system is down if our Application Insights instance has not received any new data in x minutes/hours. Originally I had used Azure Scheduler for this task, but it is deprecated and to be retired by the end of the year. As such, Logic Apps is our friend which we can use to query the same Application Insights REST API mentioned above and send an email should we detect no data.
Reporting
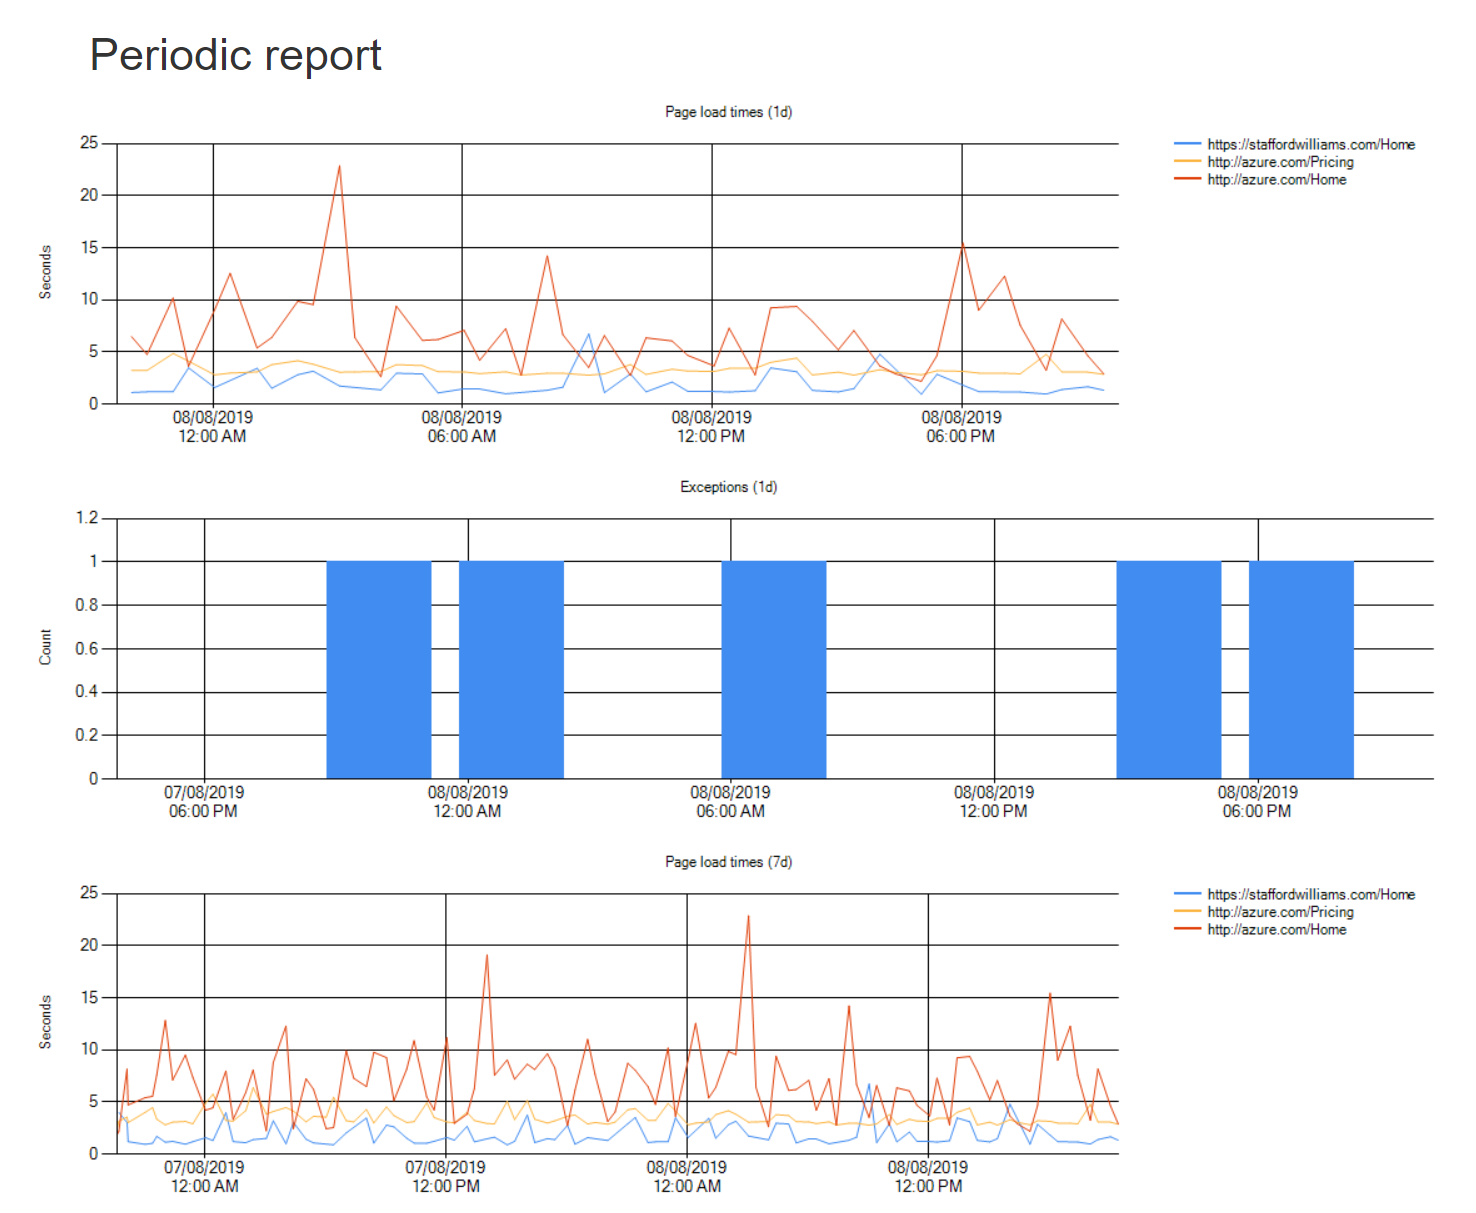
Periodically I’d like a summary of how these web properties have been performing, which would basically be a snapshot of the charts we already have generated above using Application Insights. However, Application Insights does not currently offer a way to periodically email these results, so we’ll write our own.
To do this, we’ll grab our raw telemetry data using the Application Insights REST API and we’ll ressurect Microsoft.Chart.Controls - a WinForms charting control for .NET Framework - to generate charts that look very similar to results we’ve seen in the portal. We’ll export these charts to .png, reference them in an HTML file we’ll build, and then attach them to a MailMessage for emailing. The result is an HTML formatted email delivered right to our email client.

Emailing
Throughout the above I’ve mentioned emails that we’re generating, but we’ll need something to actually send them, for example our good friend SMTP. To deliver this functionality for the cool price of free, we’ll use SendGrid which lets us send 100 emails/day at no cost - much more than we’ll need.
Conclusion
And that about wraps it up - we’ve seen that we can use a range of Azure services and integrations for free or very low cost to implement a fairly robust monitoring system. However, with the techniques described, we could expand or (totally) change this solution to meet close to any requirements we might have for running workloads in the cloud. I hope this overview has given you some ideas or helped you discover something new - if you can think of an improved way to implement the above or notice any errors please reach out!
