
Static Code Analysis for .NET with SonarQube
Whether it’s your codebase or someone else’s you’re going to build on, SonarQube can quickly and easily highlight quality and security issues without having to eyeball every line of code yourself.
The easiest way I’ve found to get SonarQube up and running is to use Bitnami’s docker-compose solution which looks all of;
curl -LO https://raw.githubusercontent.com/bitnami/bitnami-docker-sonarqube/master/docker-compose.yml
docker-compose up
This will bring up both SonarQube (and internally Elastic Search) and a supporting PostgreSQL database.
Troubleshooting startup
Ideally it should Just Work™, but I had some smaller hurdles that needed to be traversed. When you see this line in the logs, be prepared to wait a little;
sonarqu INFO ==> Starting app...On Windows this took a few minutes for me, but when I switched over to WSL2 it took five minutes and then stopped the container with;
sonarqu ERROR Pattern SonarQube is up was not found in SonarQube log: Error: Log entry not found after 300 s
There’s a GitHub issue which goes on to say for a number of possible reasons that the container did not finish booting properly.
To see what the SonarQube container is doing while it’s booting you can monitor the log using the following command;
docker exec -it <containerId> tail -f /opt/bitnami/sonarqube/logs/sonar.logIn my case it looked as though Elastic Search (part of the SonarQube container) wasn’t coming up so I yolo’d the following and the problem was solved.
sudo sysctl -w vm.max_map_count=262144 && sudo sysctl -w fs.file-max=65536Once it’s up you can browse to http://localhost:80 and log in with admin/bitnami creds. You’ll want to Create project which will also let you create a token - we’ll continue below with these by scanning our source.
Scanning
SonarQube requires that all projects you intend to scan are part of a Solution file, so add them to one if not already. You’ll also need the scanner tool, which can be installed for dotnet core like so;
dotnet tool install --global dotnet-sonarscannerIf you are scanning a .NET Framework solution, then check the docs for that here.
dotnet sonarscanner begin /k:digital-icebreakers /d:sonar.login=<myToken> /d:sonar.host.url=http://localhost
dotnet build
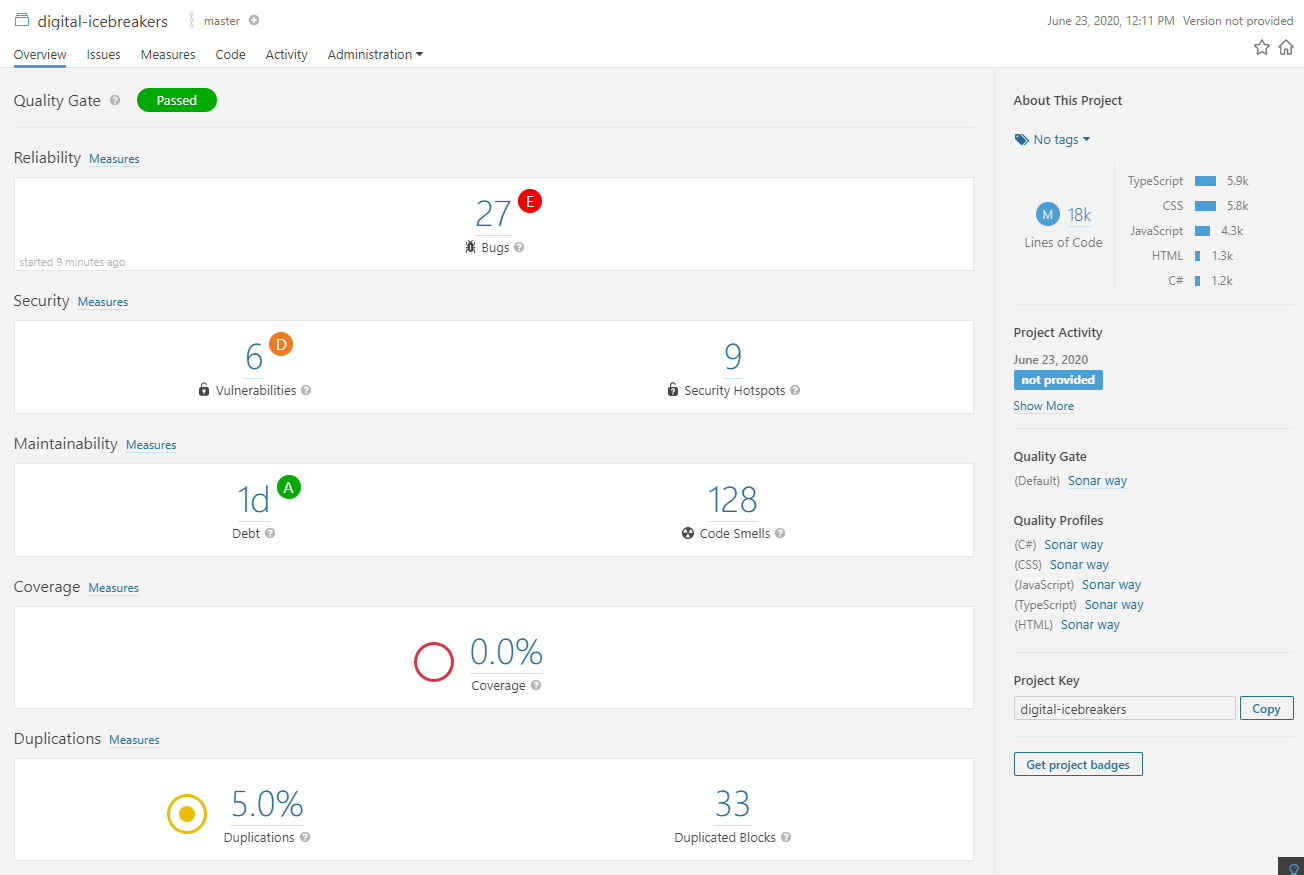
dotnet sonarscanner end /d:sonar.login=<myToken>The result took 1m21s to scan and analyse 18k lines of code. Digital Icebreakers is mostly React (TypeScript) so the breakdown looks like this;
| Language | Lines of Code |
|---|---|
| TypeScript | 5.9k |
| CSS | 5.8k |
| JavaScript | 4.3k |
| HTML | 1.3k |
| C# | 1.2k |
Excluding files
A large chunk of the above, notably the CSS and associated issues, are in fact from 3rd party static files I have sitting in ClientApp/public. I can configure the scanner to ignore these by altering the begin scan command I used above. The following command will exclude everything under ClientApp/public and the resulting image shows a significant decrease in issues once this irrelevant code is ignored.
dotnet sonarscanner begin /k:digital-icebreakers /d:sonar.login=<myToken> /d:sonar.host.url=http://localhost /d:sonar.coverage.exclusions="**/ClientApp/public/*"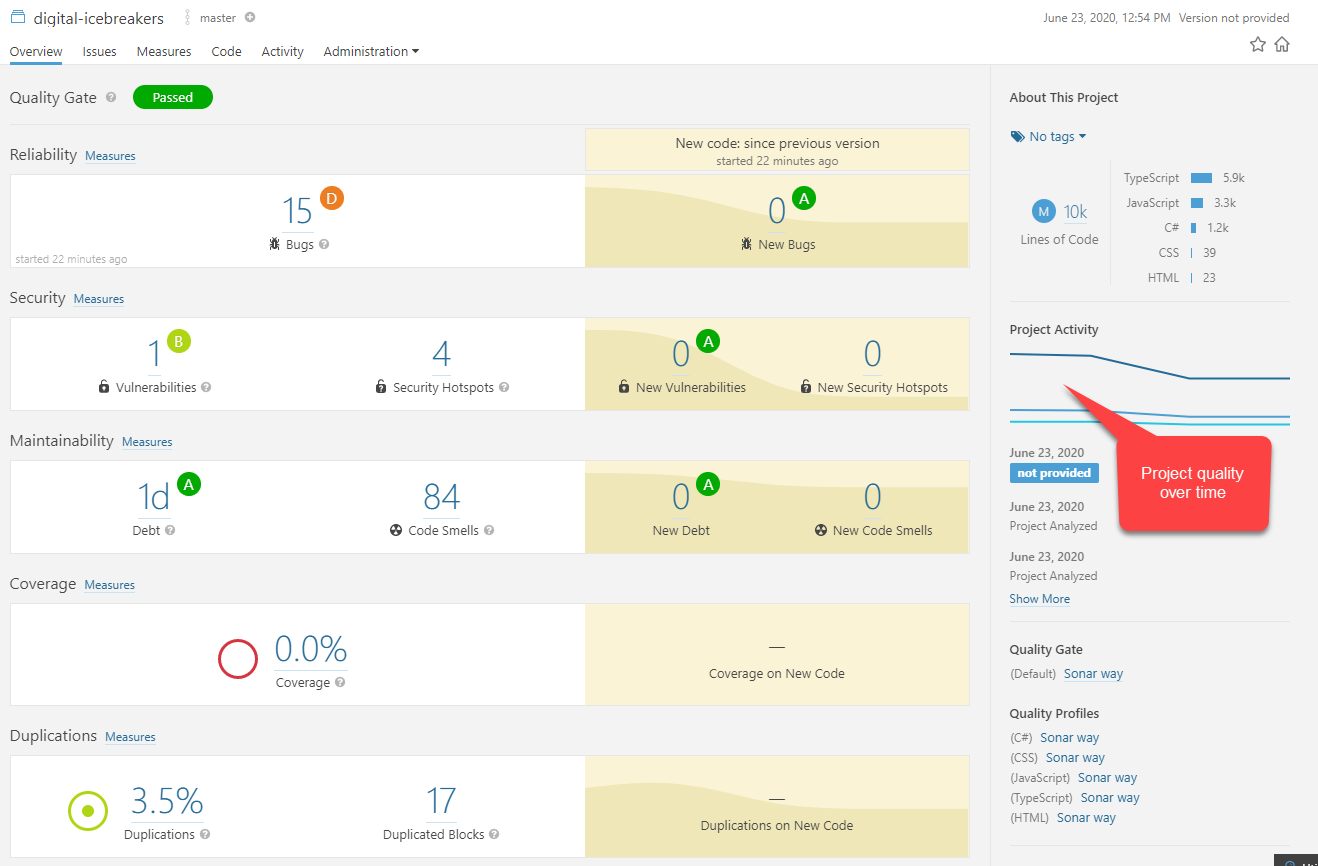
| Language | Lines of Code |
|---|---|
| TypeScript | 5.9k |
| JavaScript | 3.3k |
| C# | 1.2k |
| CSS | 39 |
| HTML | 23 |
Conclusion
In under thirty minutes you can be investigating technical debt, security vulnerabilities, test coverage, code duplication and other refactoring and bug fixing opportunities with SonarQube. Try it against Digital Icebreakers or against your codebase.