stafford williams
spacetraders-v2 v2.1
grafana dashboarding
With close to 24 hours of leaderboard data I can improve my Grafana dashboard.
By default the tags in an influxdb query like SELECT "credits" FROM "most-credits" WHERE $timeFilter GROUP BY "agent"::tag results in the legend displaying the tag names like this: most-credits.credits { agent: 100L-TRADER }. This redundant information can be removed in the dashboard by going to Edit Panel > Transform data and adding a Rename fields by regex transformation. I used .*agent: (.*) } as the regex.
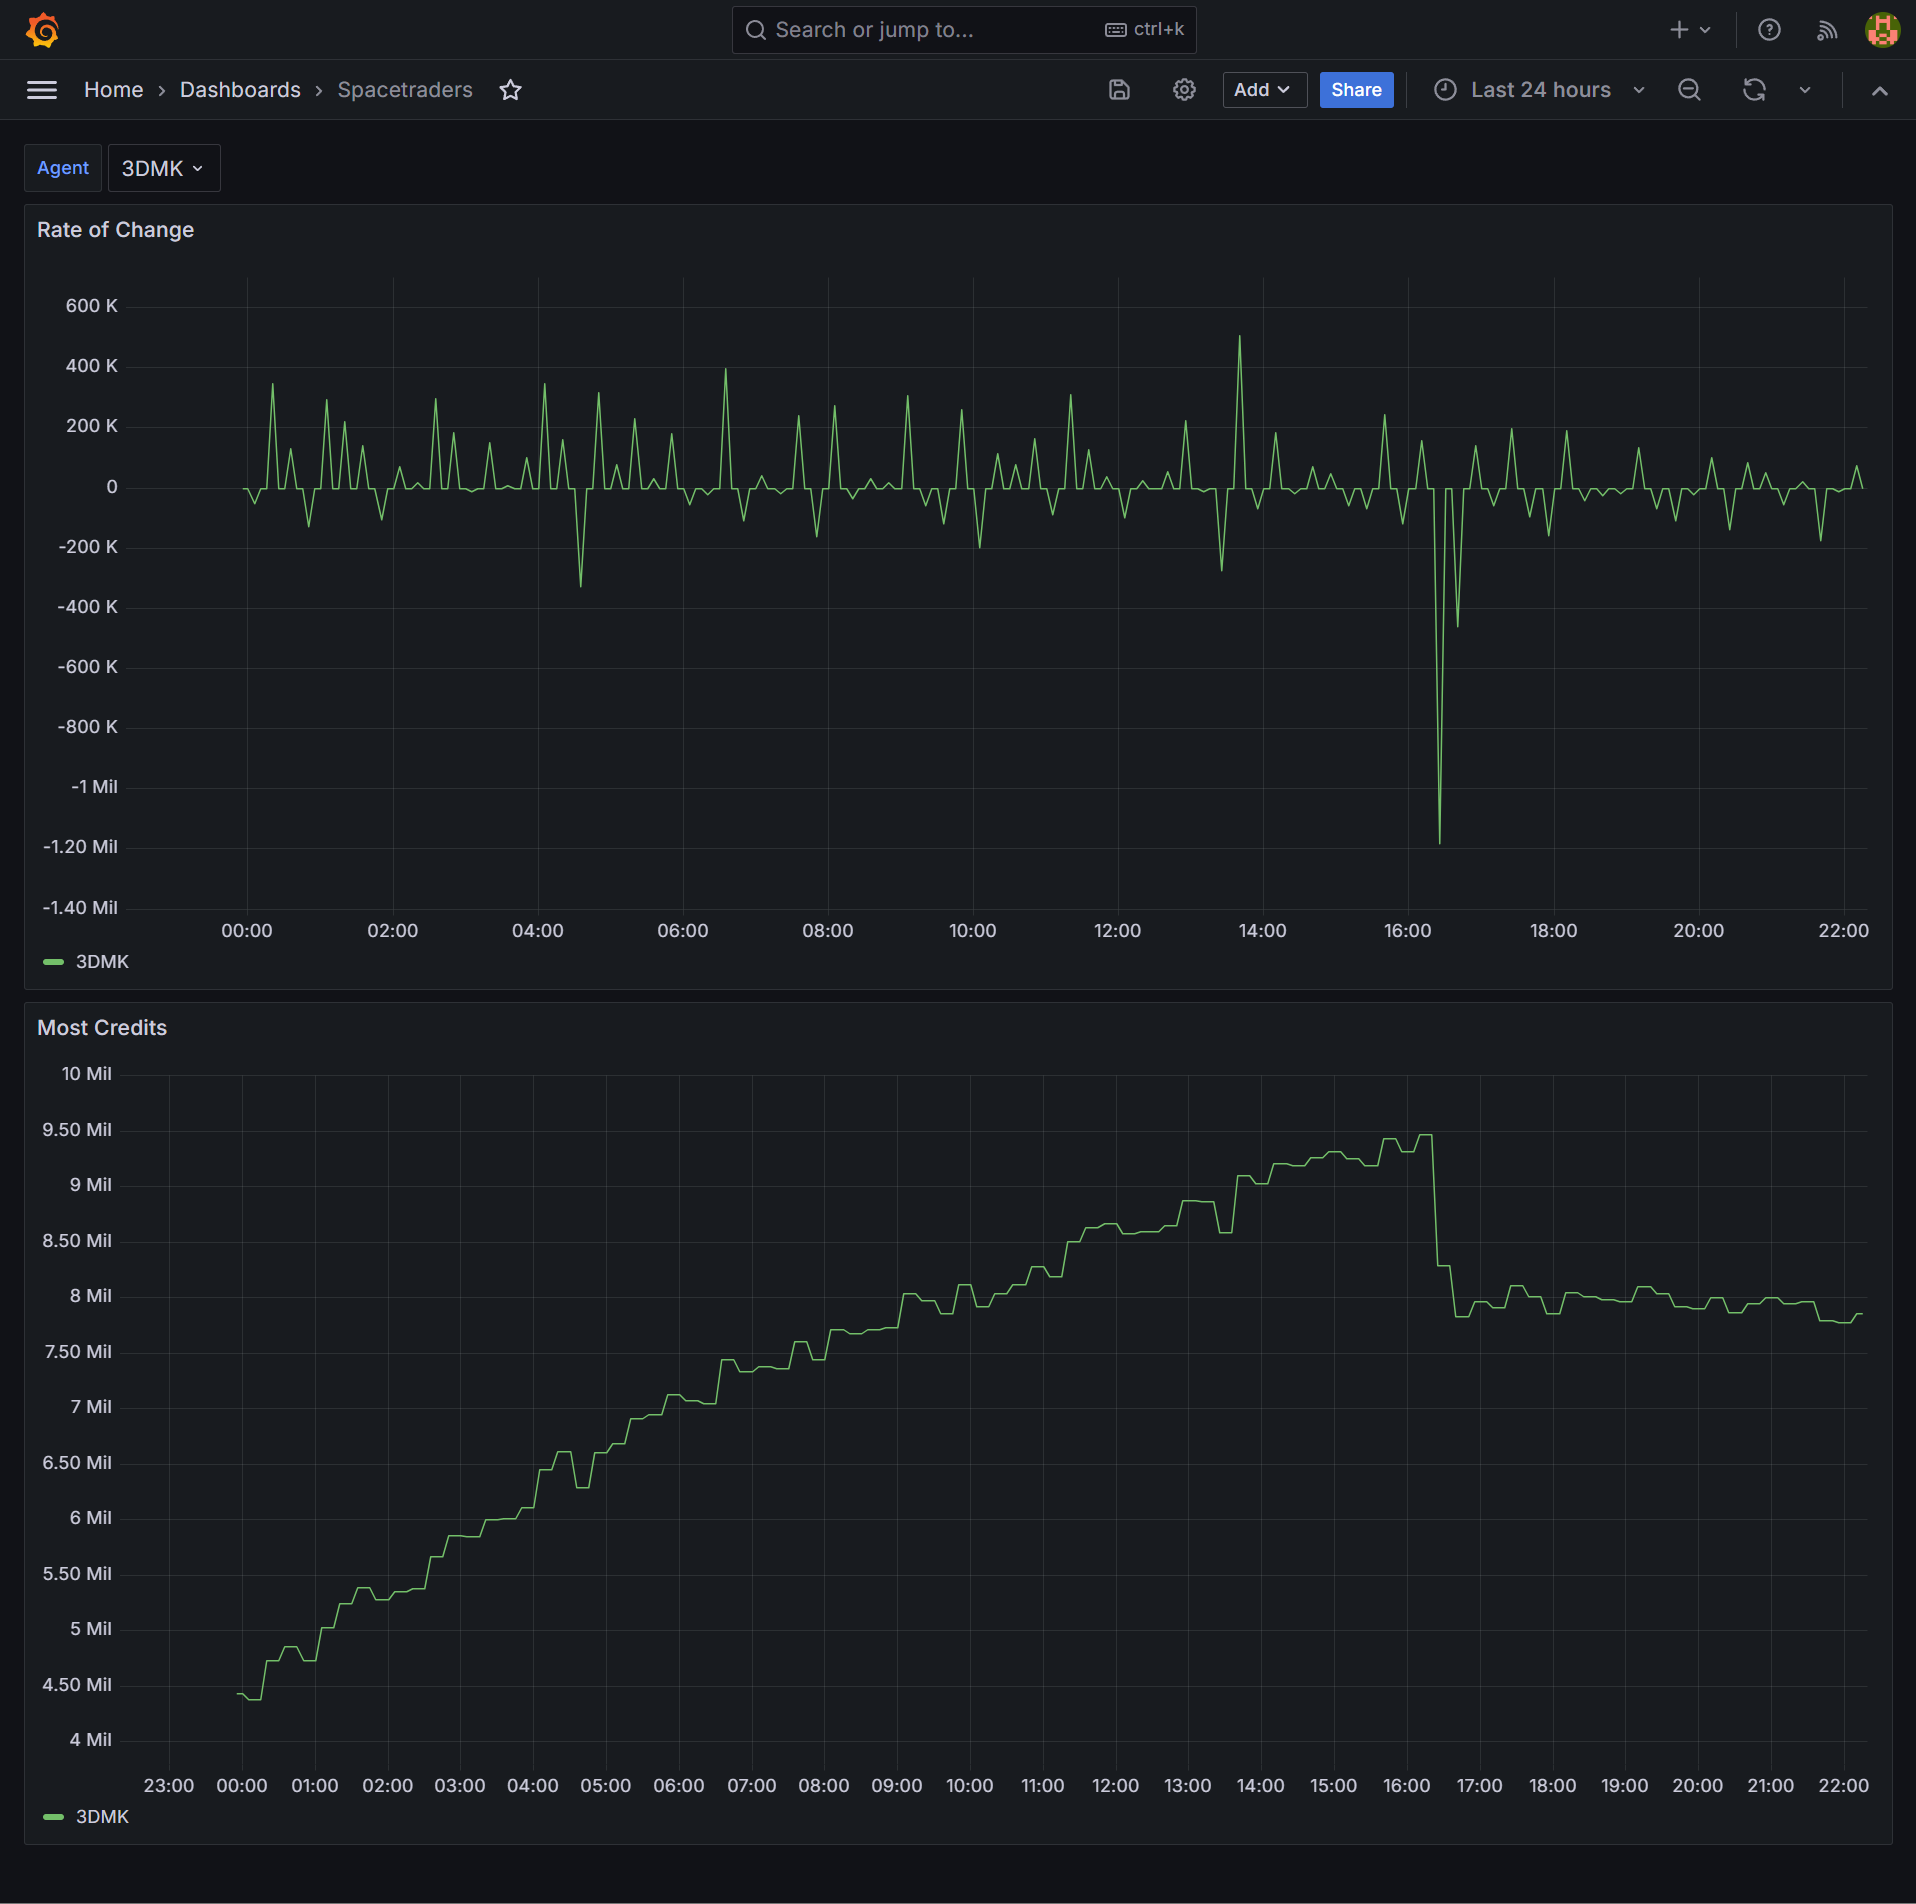
I wanted a visualisation that would display the rate of change of credits over time, and influxdb’s DERIVATIVE function can perform this.
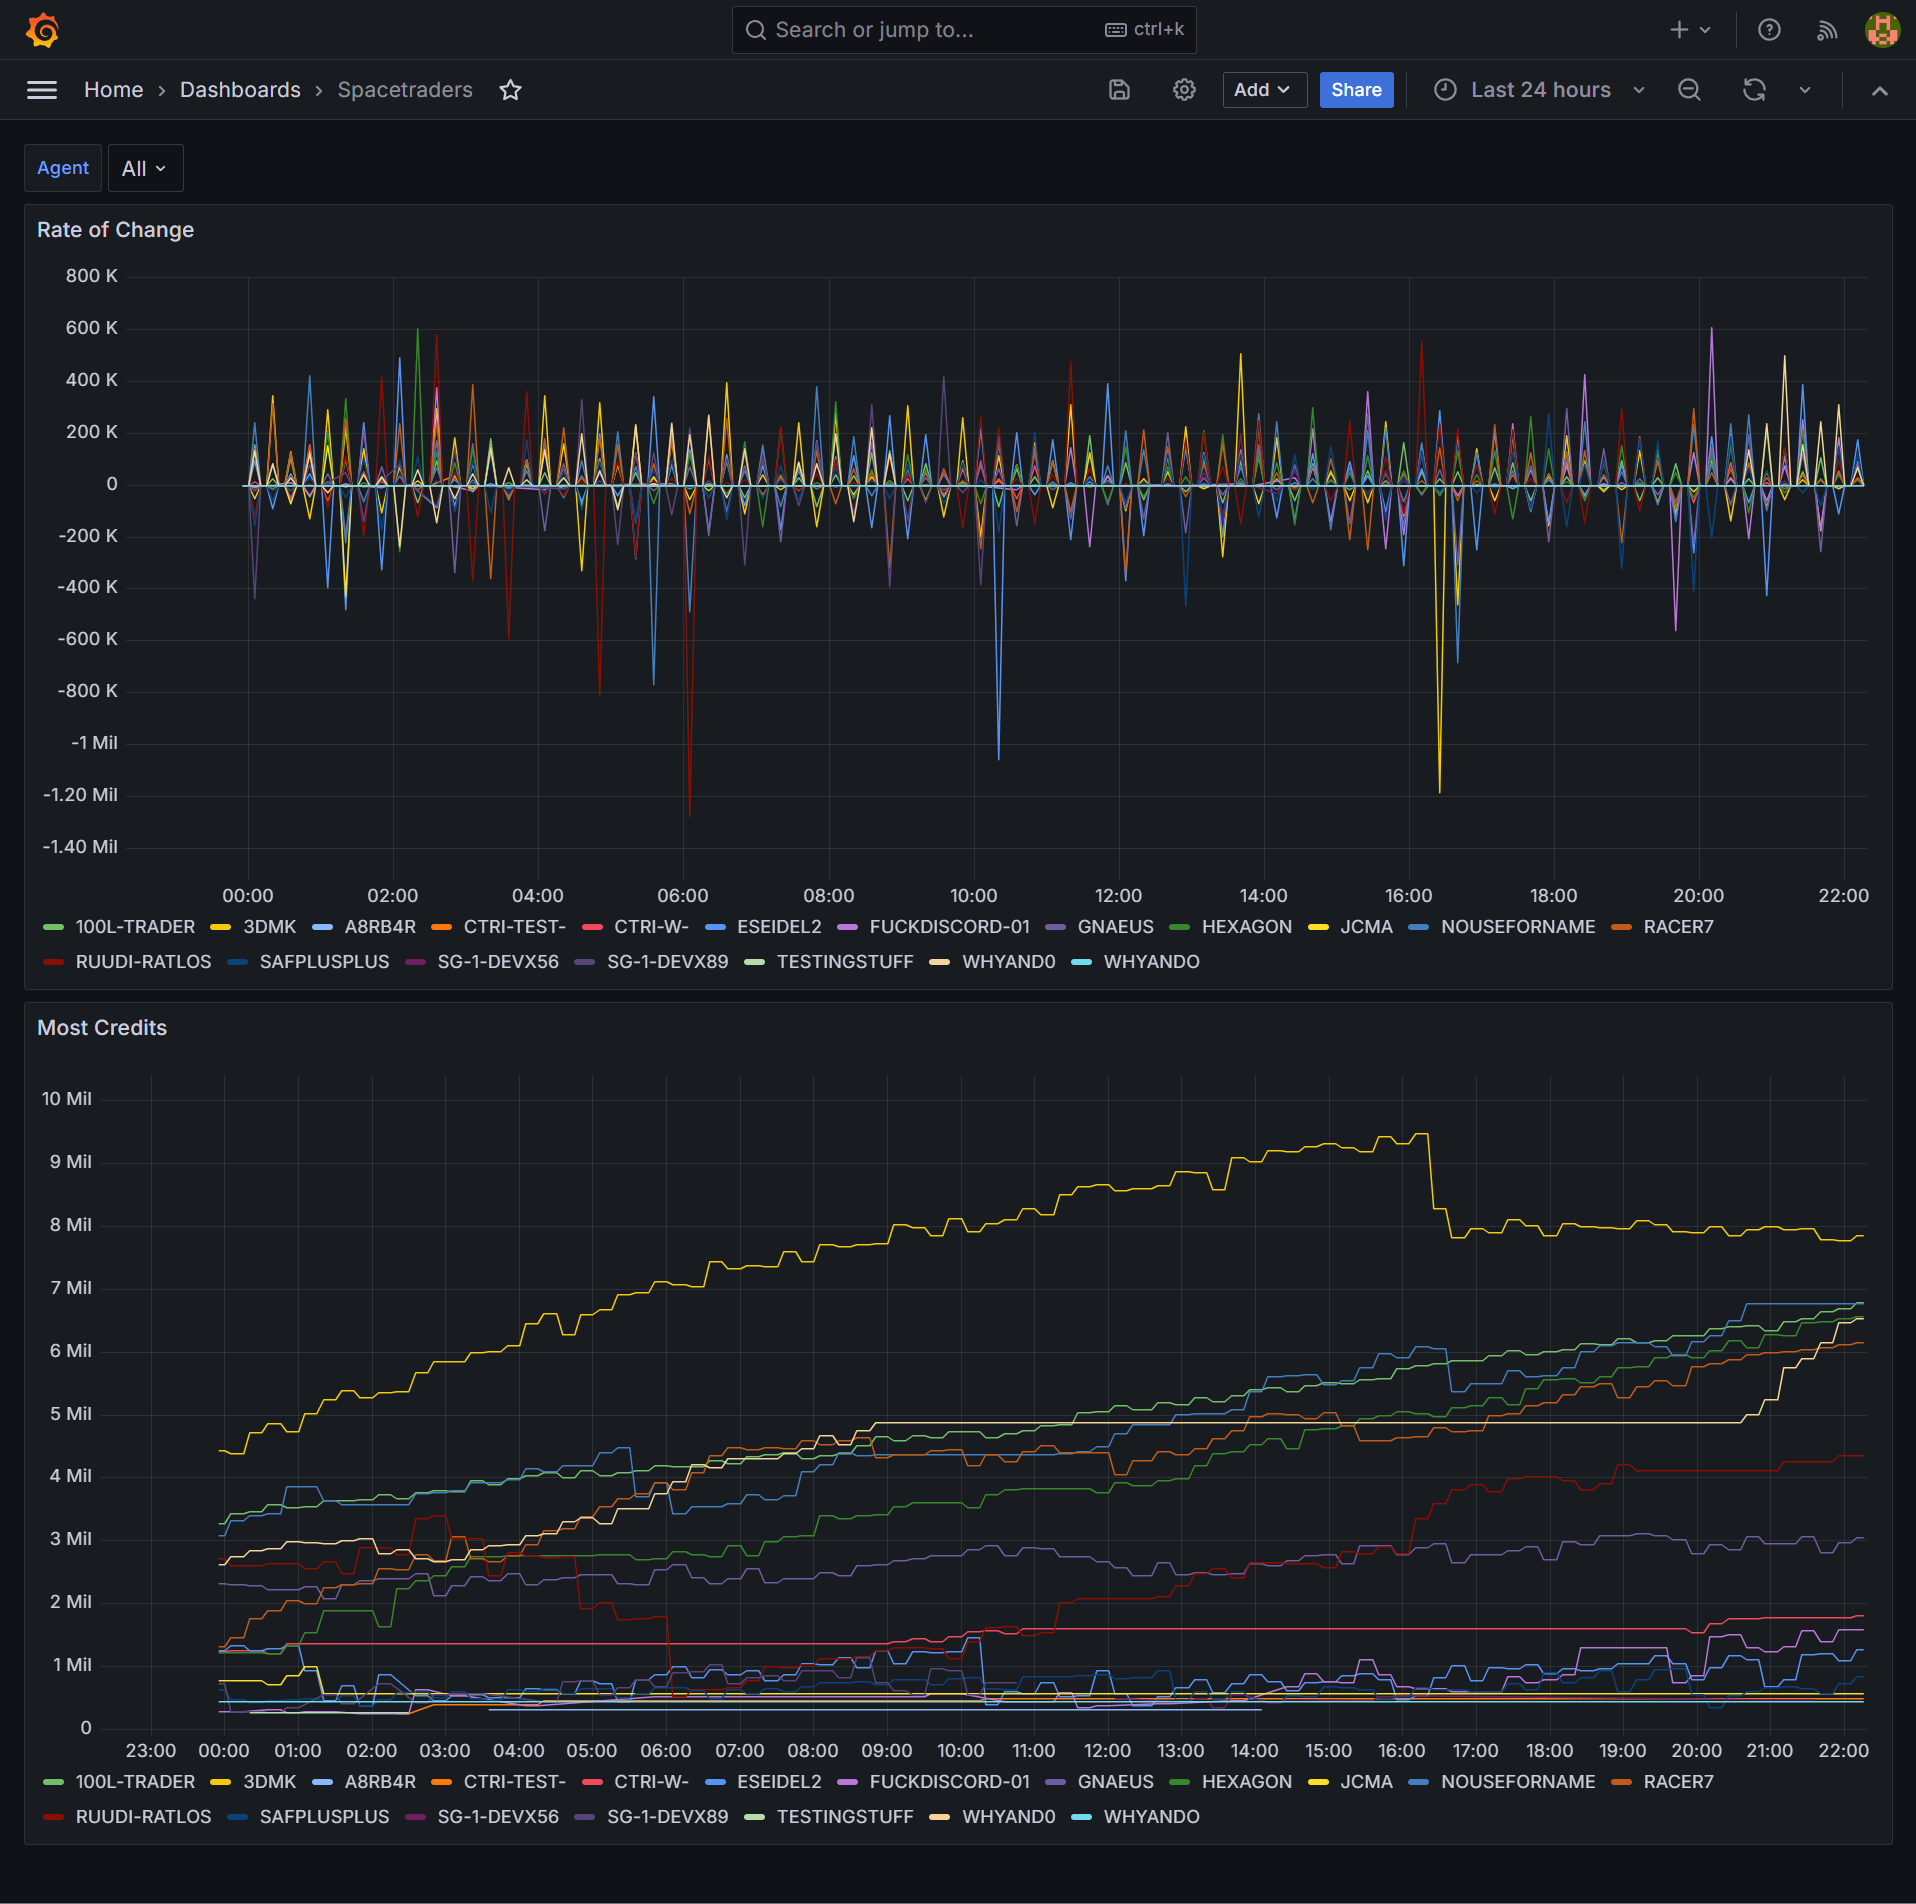
Finally, adding a Dashboard variable allows filtering all panels in the dashboard by the selected variable. Under Dashboard settings > Variables I added a variable agent with the query show tag values from "most-credits" with key="agent". Each panel’s query then can be updated to include a WHERE ("agent"::tag =~ /^$agent$/) clause.